Why Yangarra?
As one of the top performing Energy Stocks on the TSX this last year one should stop and look in depth at the numbers to ask the question, why Yangarra Resources. This energy stock has been one of my favorites and I have owned and may continue to own this stock(or not) and this post will go over the numbers within the high performance. We can also use these numbers as a template for what other stocks should be on the list of “potential” stocks to own in the coming year.
Stock Chart
The stock chart that follows illustrates the performance that you missed out on if you didn’t own this stock.
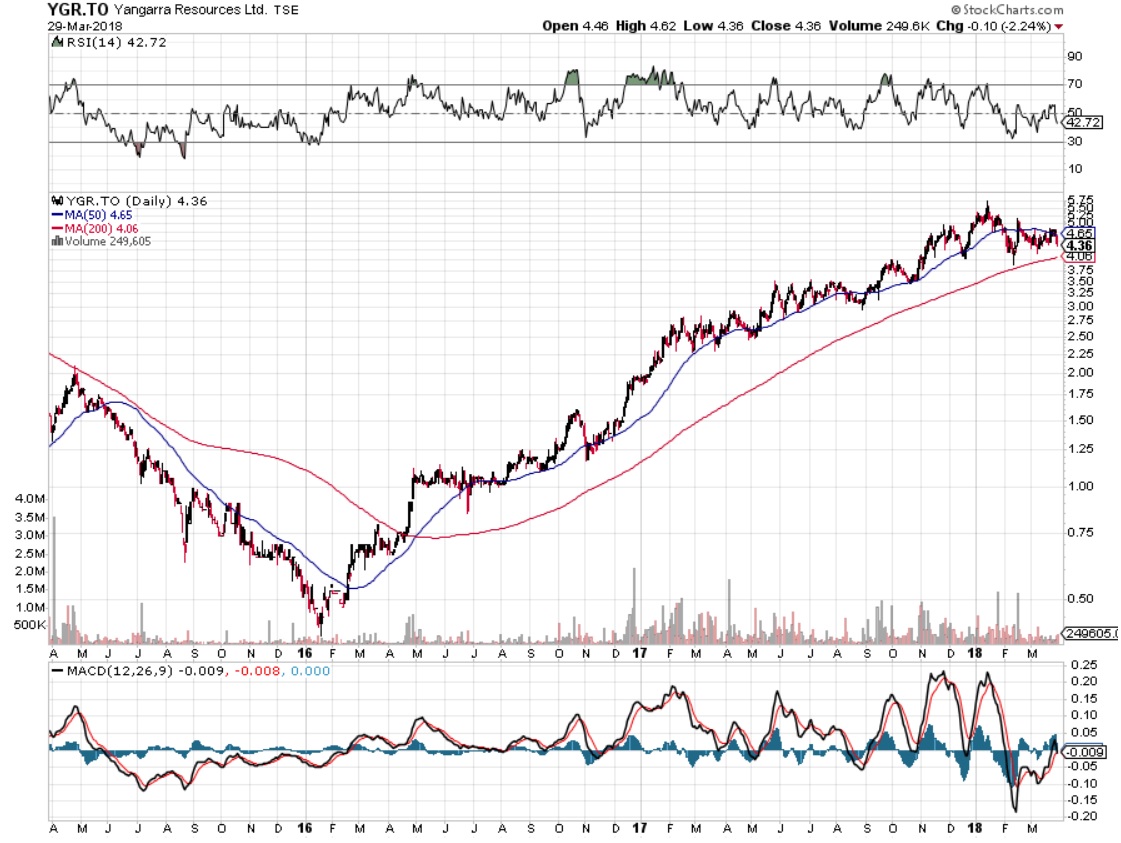
Yangarra Stock Chart, courtesy Stockcharts.com
As you see the stock has been on fire, up over 6x over the last 2 years. This performance comes in spite of many brokers that I have talked to opining that either I should own one of the “glamorous” 5 such as Arc Resources or Seven Generations(both down over that time ) or I should not invest in any “Canadian” Energy stock as they are all terrible. Why would this stock outperform even some tech or marijuana stocks over the same time period? Let’s drill down into the numbers to see where we can get some idea of the basis of that performance.
Production and Cash Flow per Share
One of the favorite metrics that I like to look at is the production per share to see if a stock is growing or not. The per share numbers give you the ability to strip out the fake growth of companies that issue a lot of stock during takeovers or massive growth spurts. High share count increases dilutes the “shareholder” away from the potential growth of a company and allows the management to press release growth numbers even though the growth may be mediocre(aka Crescent Point).
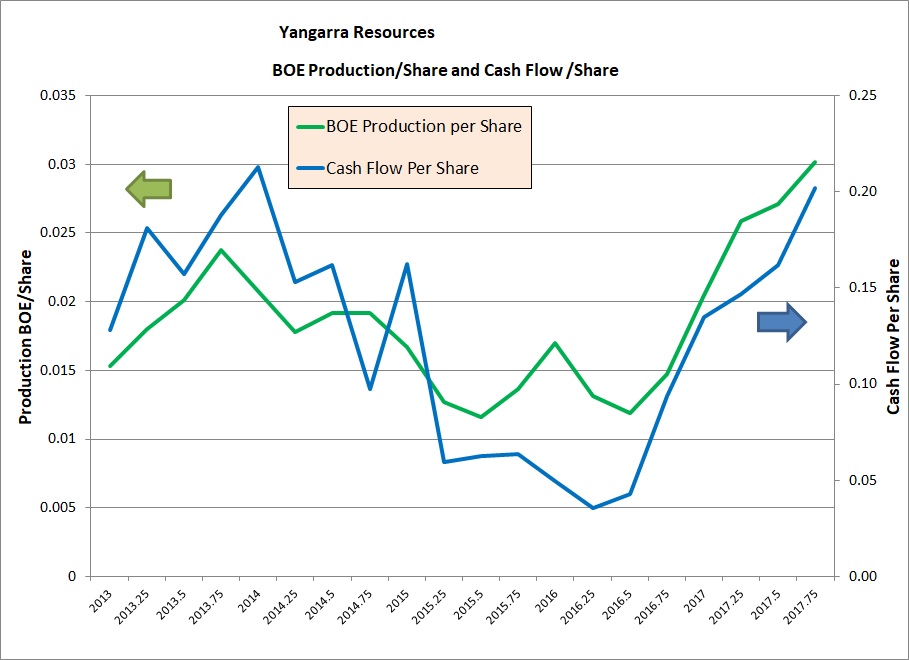
Yangarra, Production Per Share
Starting in 2015 Yangarra started growing their per share production and over the next two years doubled their production per share. Since production per share is the basis of energy companies cash flow and value, in essence the value of the company doubled over two years. This is what investors owned when the shares were purchased, a small company that doubled in production per share over two years, impressive.
Debt/Cash Flow
Next as a check we should look at the debt/cash flow. This helps the investor to gauge how much debt has been taken on to finance the growth and is the company moving into the high debt zombie company realm. A good rule of thumb for production companies is a debt/cash flow ratio of 3 or less.
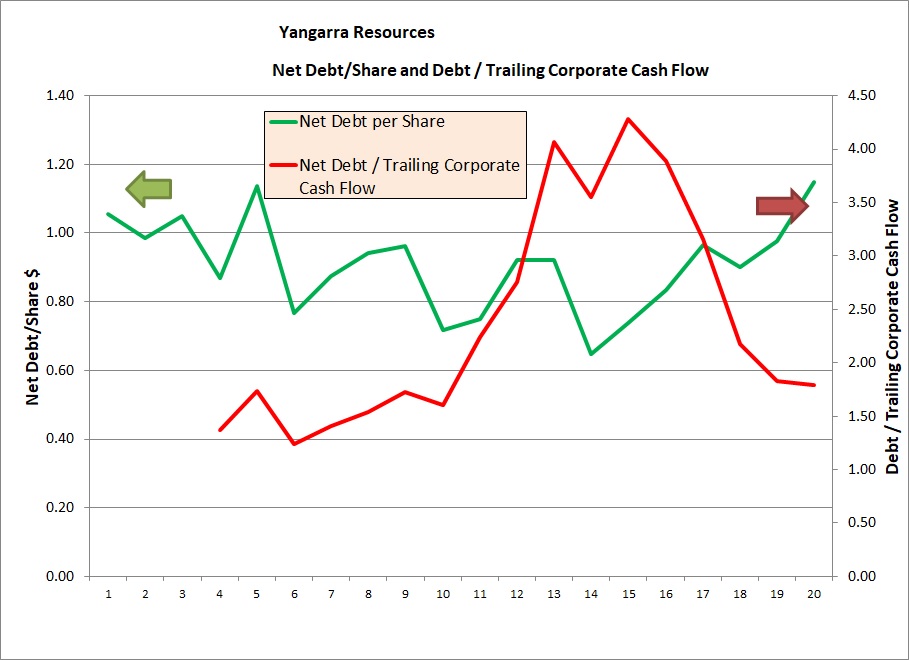
Yangarra, Debt/Cash Flow
The company did have a poor debt/cash flow but the high growth they managed to achieve allowed the ratio to drop to a more manageable 1.8 in the latest report. This illustrates the value of good growth numbers to these companies, without that growth the company would have maintained the high debt levels and eventually had to pay off the debt with asset sales.
Reserve Net Asset Value
This website is all about energy companies(and others) net asset value, and for energy companies that is the value that they publicly declare every year in their reserve reports. Energy Companies on the TSX are about 95% done releasing their yearend reserve reports. Yangarra has released their 2017 yearend numbers and they were excellent with reserves in all categories up materially.
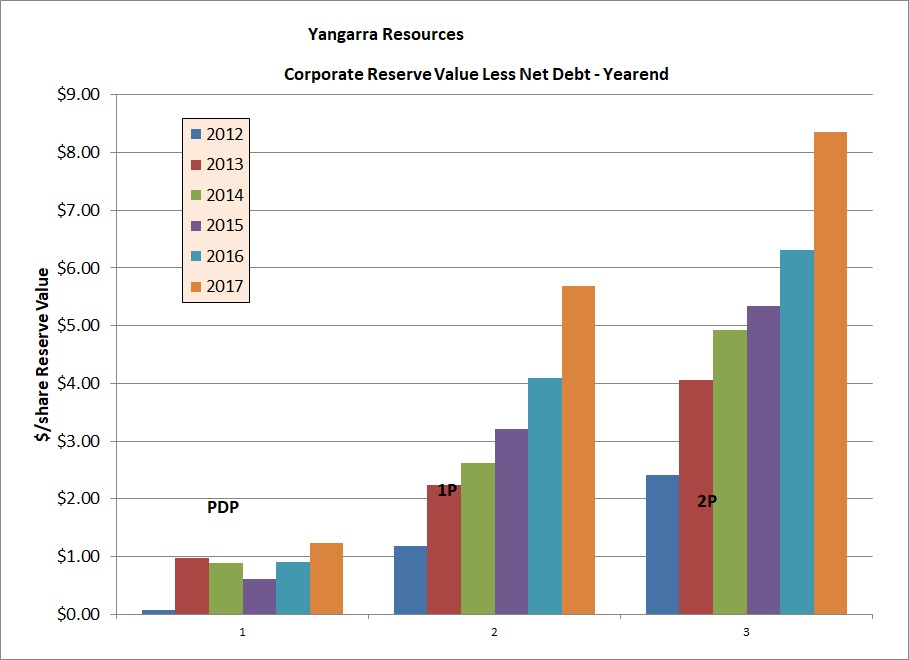
Yangarra, Reserve Net Asset Value
The chart illustrates the main points, every year the reserve net asset value has gone up. As of yearend 2017 the Probable reserve value(2P) is over $8.00/share, while the stock is trading at $4.40.
Conclusion
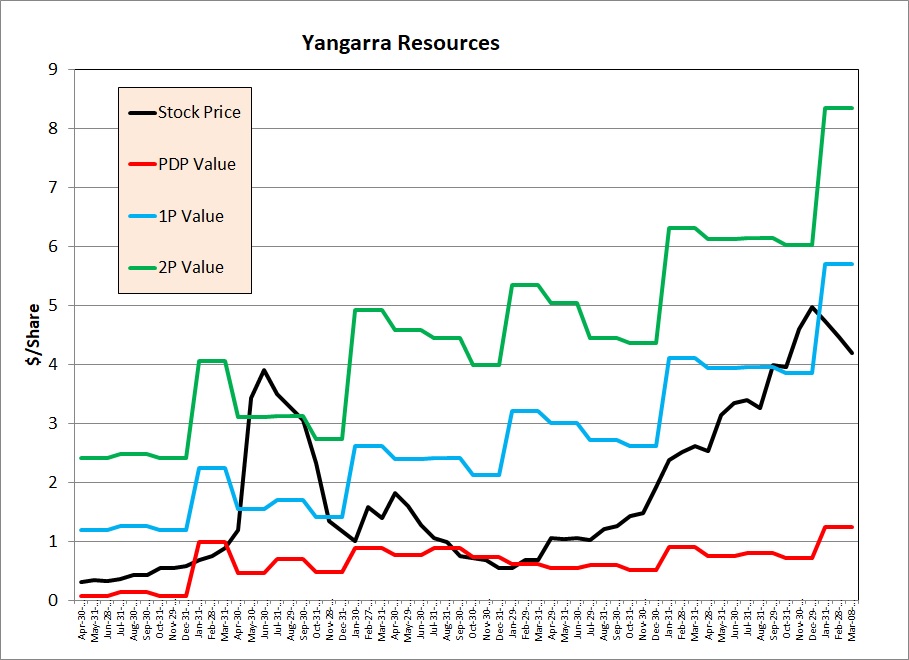
Yangarra, Net Asset Value
This chart puts it all together as the stock bottomed in 2016 it was trading at it’s PDP value. This means that the stock price just reflected the value of the producing wells less the net debt. All of the upside of their future drilling locations was free, amazing. Another way of looking at this chart is if they can continue to increase their NAV by 30- 40% a year the stock price could grow by 30-40% a year and not be over valued. This ability to own a growth company stock that still is not overvalued is the trifecta of investing. This is illustrated by following the blue line(proved reserve NAV) vs the black line(stock price)
The combination of growth the production per share at high rates, manageable Debt/Cash flow and a stock price that is not overvalued when looking at Net Asset Value is golden. At the end of April when all the companies should be done reporting their reserves and yearend production numbers I will post a stock list of companies that have this signature characteristic. From this list you the reader can do further research to fill out your investing portfolio.
Now for the cautionary tale that should give you pause before you mortgage the house and buy this stock, it is a small company still with a market capitalization of $355 million which is tiny compared to Suncor at $73 Billion. This allows the company to grow fast but it won’t last forever. I would keep an eye on the production per share growth and the Net asset Value to make sure it doesn’t get over valued. Also as of the writing of this article the Market Risk Indicator is turning down indicating that the stock market is turning riskier and could be rocky in the months ahead. As always consult a qualified financial adviser before buying or selling any security.