
When will it end? (Updated Data)
In my last post the topic was When will it(the Oil Downturn) End? Now it is time to revisit the production charts and forecasts to see where we are in the healing of the energy market downturn, and plot a course to the recovery of this important part of the economy.
“It is difficult to make predictions, especially about the future”, Danish politician Karl Kristian
“All models are wrong, some are useful”, British statistician George Box
US Oil Production Forecast
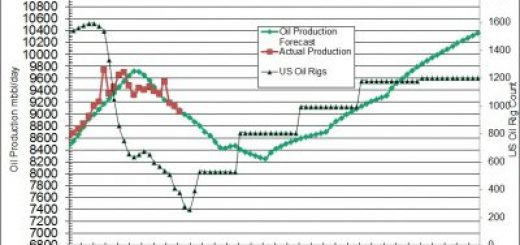
If you go the the previous post you can see the scenarios that I modeled going into the Covid shutdown of the world economy and what might happen to the rig count and oil production in the United States. With updated data to Oct you can observe how optimistic the early part of that forecast was.

US Oil Production Scenarios, Rig Count from Baker Hughes Rig count, Oil Production from the US Energy Information Association
The black line in the plot is the updated oil rig count, compared to the colored dashed lines which are the old forecasts. I greatly under estimated how low the rig count would go as the actual count was 100 less than my low side scenario.
On the green line you also can observe that my oil production forecasts missed the mark in also being too high. There is something about negative oil prices on the futures market(even if it wasn’t realized in the cash market) to convince operators to shut-in high cost marginal production and stop completing their horizontal well inventory. The go forward oil production forecast now is about 2 million bbl/day lower due to the lower rig count and will likely not get back to previous highs.
Non US Oil Production
Non US oil production was expected to be on a consistent down-trend based on natural decline and OPEC cuts in production. Actual production dropped much more as OPEC and Russia slashed their output to help balance the markets.

Non US Oil Production Actual and Forecast, Source US Energy Information Association EIA
The solid green line illustrates the actual production that dropped to 71 million bbl/day and then bounced back as the oil price recovered from it’s lows. I would expect the production will continue to climb back to the original forecast as OPEC and Russia unwind their respective cuts over the next few months. After that natural declines will kick in even as spending ramps up in 2021 with a recovery in the oil price.

World Liquids Supply Forecast, Data from EIA
This graph is quite busy but we will step through it slowly The black dashed line is the updated liquids demand which was lower than originally forecast and is now forecast to recover slower in 2021. This seems reasonable as some demand is back to pre-Covid levels such as gasoline but other items such as Jet Fuel will take longer.
The green line is the original liquids supply forecast and the green dashed line is the new updated actual production with the forecast. The vertical black line is the division between the part of the graph that is historical data(to the left) and forecast (to the right). As can be observed the new production forecast and actual is much lower than the original with the combination of large OPEC, Russia and frankly the rest of the world production cuts. The lower rig count and the longer time to recovery will also constrain the US production much lower than anticipated. When these forecasts are added together the future production will be lower than the original forecast by 3 million bbl/day
So when this is put in the model the yellow dotted line is the new OECD inventory actual and forecast. Not only did the inventories not peak as high due to the large production cuts, but they are dropping sooner. I would expect a normalization of the oil markets by year end with pricing to follow soon after. Of course this will not be realized immediately, and there could still be a Covid setback on the world economies, but this sets the stage for the future.
Conclusion
There you have the updated forecast. The oil markets should be effectively over the downturn by the end of the year and we should look forward to sunny skies ahead with rising oil prices, and rising stock prices. Since Covid is not cured as of the writing of this post there will be many ups and downs over the next year but the ups will start to be more pronounced and by this time next year many stocks should have doubled in price. If you are looking for some ideas to accumulate look at the data table on this website. I would screen out stocks that have too much debt, say more than 4 time cash flow, as they could still hit a wall over the next few months. Sort by the most upside to NAV and pick the ones you like to buy. As always I am not an investment professional and you should check with a qualified professional before you buy any stock. Enjoy.
Addendum
If you want to build your own model, remember the quote at the start of the post, I like the EIA website for lots of good US and international data. It is where most of the data used on this post was derived from, and I believe it to be accurate and best of all free.

Can’t end soon enough