When will it(The Oil Downturn) end?
This has been an unprecedented time in the stock markets, and in the world. Covid -19 has ravaged the world economy and as of writing this post, still dominating the headlines and impacting our daily lives. While I could opine on when the pandemic will end, there are many articles and posts on the internet from people that are more experienced and knowledgeable in that matter than yours truly, so I will leave that space to them. Instead let’s have a look at the oil markets and ask, when will it(The Oil Downturn) end?
OPEC Meeting
Recently there was an OPEC meeting where cuts were announced in production. In an unprecedented turn with this meeting, other non OPEC countries also were there as observers. The announced cuts were 9.7 mmbbl/day, which although a large number, are smaller than the drop in demand as a result of the epidemic. Now as we have opined on this blog before (Look to the Past to Predict the future) the bottom in the oil markets usually coincides with an OPEC cut in production. So as of the writing of this article, the price of oil having dropped below $20/bbl WTI it is probably either the bottom or close to the bottom. Or is it. Let’s have a look at the fundamentals.
Non US Production Forecast
If you need to predict the future it helps to have a model built to calculate a scenario that could be true. Although the maxim that states “All models are wrong but some are useful” we shouldn’t bet the farm on any model of the future, it could be useful to go through the exercise to see what comes out.
The following chart is a spreadsheet model of World liquids production other than the United States. The reason I built it this way is that the US forecast I already do on this Blog so running scenarios on that model is easy. The world forecast is much more complicated, so let’s over simplify and assume that all productions drops by a % decline every year. Also lets assume that a given CAPEX is required to maintain or grow that production with a $/bbl/day production add requirement. These assumptions are wizard-ed up in Excel with some simple formulas and this is what results.
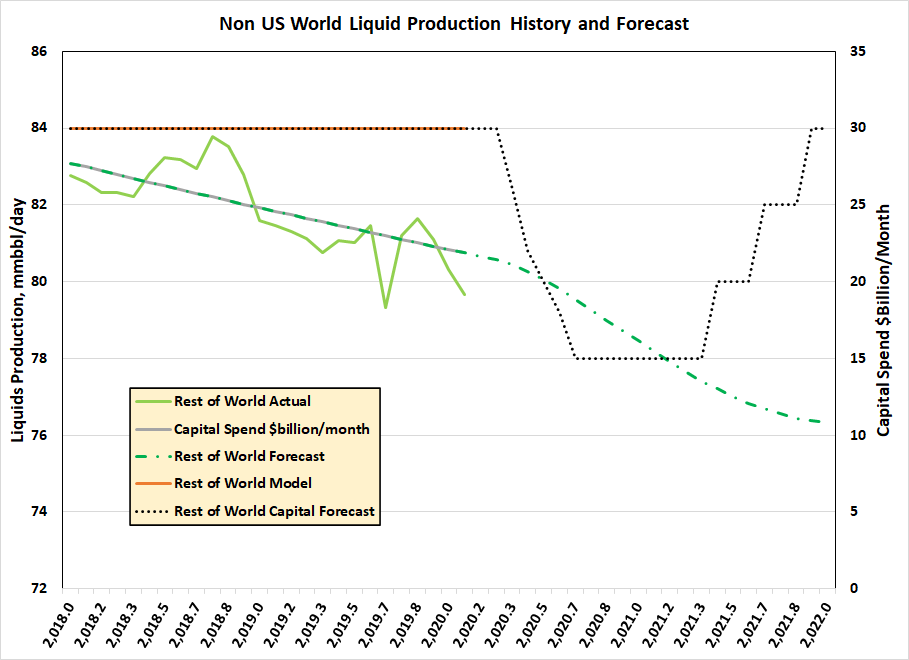
Non US Production and Capital Forecast, Data Sources EIA, NAV Information
There is a lot in this plot so lets try to unpack it. The first half is the attempt to history match actual production and Capital spending outside of the US. Capital spending was running at a rate of $30 Billion a Month and production was declining from 83 to 80 mmbbl/day over 2 years. Given the match that results then put in a CAPEX drop of 50% until Q1 2020 when the spending in the oil patch gradually ramps back up to where it was before. You can see the problem, even with capital spending back to the starting point, production has dropped to just over 76 MMbbl/day. This is problem that will result from the drop in spending. The glut of oil in the market from shale drilling in the US caused capex in the rest of the world to be insufficient to maintain or grow oil production. Not good if you own or plan to buy a large pickup truck when the prices are as low as they are today.
United States Drilling Forecast
The US Oil production forecast is much easier as the model is already built and has been updated on a somewhat frequent basis on this web site. The standard forecast that I use though, is that the last rig count is just going to continue on at a straight line forever. That never happens so let’s make up some scenarios and run them through the magic spreadsheet.
- Drilling drops in 1/2 to 335 rigs over 3 months but then starts rising rapidly starting April 2021 to 720 with a year. This would assume that oil companies could find the capital to do the drilling and haven’t all gone bankrupt during the downturn. The delay to April is due to companies needing some time with higher prices to have the confidence to return to drilling wells. We will call this our base case
- Drilling drops further to 290 rigs over 3 months and stays there until Aug 2021 and then begins a slow ramp to 710 rigs. This we will call our downside case. This could happen if the price stays down longer and lower and more companies balance sheet becomes impaired. Also this could be the scenario if COVID stays around longer and the world economy does not recover quickly. This will be the downside scenario
- Drilling only drops to 400 rigs and rebounds in Feb 2021. This will be the optimistic scenario just to test what could happen if oil companies get access to too much money.
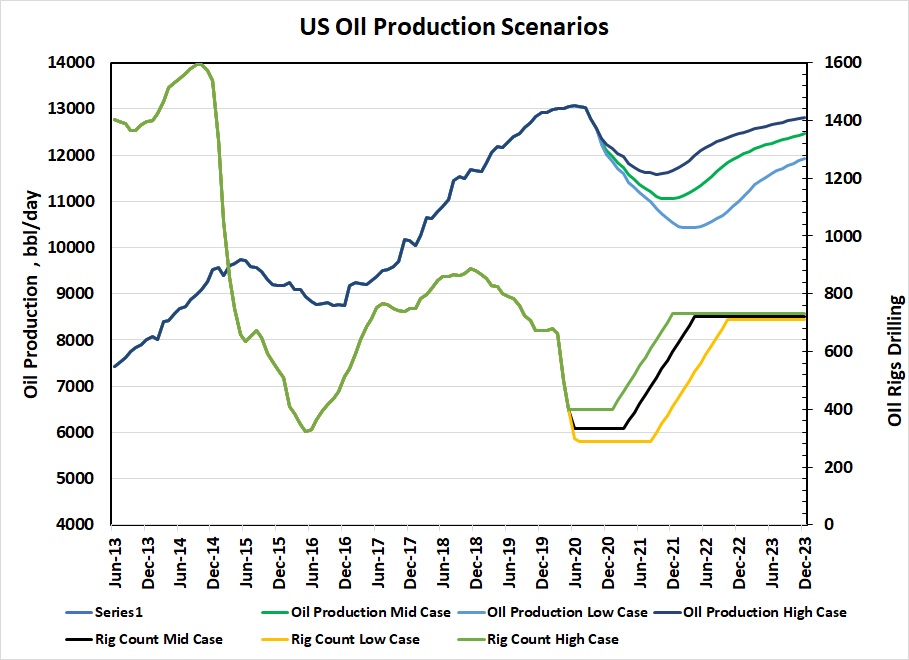
US Oil Production Scenarios, Data Sources EIA, Baker Hugs, NAV Information
As can be observed on the graph, oil production in the US could drop by 1500 to 2500 bbl/day depending on what happens with drilling and completing wells. This is exactly what happened during the last drilling downturn in 2015 – 2016 and it will happen again now. So with the US forecast complete let’s put it all together and see what happens.
Pulling it all Together
With a few copy and pastes we add these two forecasts together and taking some inventory data from the EIA we have the final product
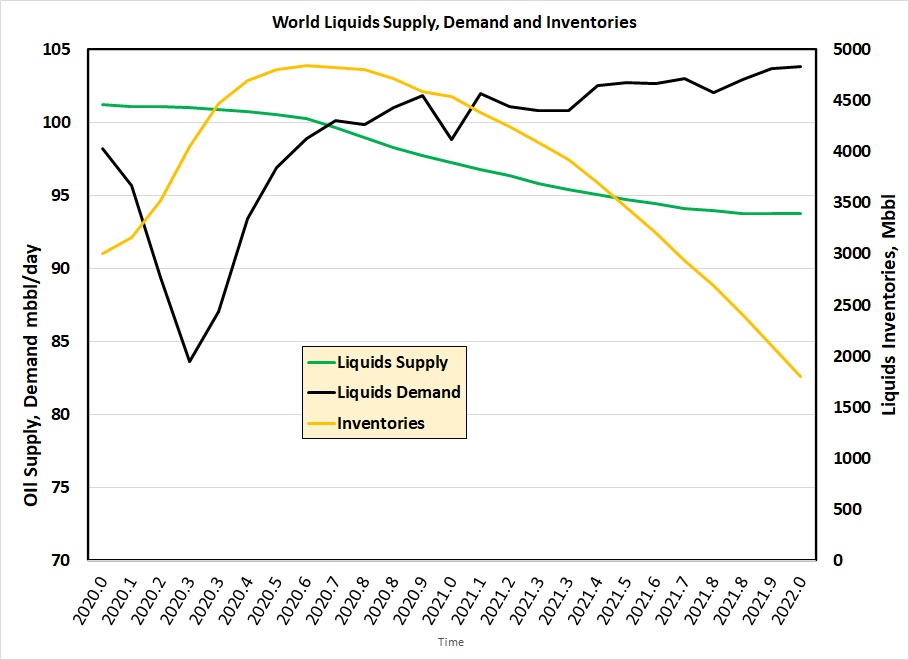
World Liquids Supply Demand and Inventories, Data Source EIA, NAV Information
The liquids demand forecast is just copied from the EIA website as I have no insight on what will happen to demand. In my opinion this is an optimistic demand forecast as the world economy will likely take more time to heal than this forecast
If all the previous assumptions and calculations are right (IF), then inventories should peak around August 2020 but probably won’t be obvious until Oct when the draw-down will start to accelerate. Now some big caveats this model does not factor in OPEC shutting in production. Also what is not in this model is what happens if inventory capacity fills up. The reality then is production drops further and inventories cap out. When inventories start to draw down, OPEC, will just start to cheat on their quotas and ramp up their production slowly. Of course this model is wrong but I hope it is useful.
The more important take away from this exercise is the gap between supply and demand by the end of 2021 of more than 7 mmbbl/day of liquids. Capex and drilling would have to ramp up faster and further to close this gap. I don’t know about you but I bet I could not find 1 oil executive on the planet that will start to increase spending in a few months to close this gap.
Conclusions
There you have it, inventories will climb by 1.5 Billion bbls in the next few months(or until the tanks, storage caverns and tankers are full) and keep oil prices suppressed for most of this year. Keep and eye on the green shoots such as oil inventories or even prices climbing for some reason(there are many oil buyers that look ahead). When the news cycle is the worst and there is blood on the streets you could buy some of the companies stocks that are on this blog. I would go to the Data Table and sort on Debt to Cash flow though. Any stock with high debt to cash flow may not survive to the end of the year to enjoy the resurgence that should happen in 2021. Before you buy any stock consult a qualified financial adviser though since I am neither a qualified adviser, licenced to advise or nor do I even give good advice. Remember this is just my attempt at predicting when it(The Oil Downturn) will end. Enjoy.