Harnessing the Power of Neural Networks
If you have been recently looking at the Market Risk Indicator you may notice that the primary graph has changed. After months of testing and adjustment this new methodology appears to be ready for prime time. In this post we will dive into the science behind this new idea as this website starts to harness the power of Neural Networks to utilize credit market indicators and forecast stock market movements.
What is a Neural Network
There have been many thousands of pages written on neural networks on many, many blogs so I don’t have to reiterate any of that just point you to links to articles.
https://news.mit.edu/2017/explained-neural-networks-deep-learning-0414
https://aws.amazon.com/what-is/neural-network/
A more sophisticated version of a neural network is ChatGPT which you would have to living in a bunker to not have heard about. Same as above lots written about it that you can read.
What this Web administrator has done is take the same technology and repurposed it for predicting the future of the S&P 500 which seems to be a good proxy for other markets that we are interested in. If it is possible to PREDICT when the stock market may be weak, then risk management is possible to reduce stock positions and hold cash into a downturn. The other advantage of doing this is that you hold cash at the bottom to buy stocks at more reasonable valuations, perfect.
How Was it Built?
The same ingredients went into building this neural network that make up the Boom Doom(link) indicator. Credit stress, money supply growth(liquidity), interest rate changes, market breadth of several leading subsectors of the market (semiconductors, small-caps, financial stocks, etc.). Neural network architecture is maturing depending on the problem that is being solved and how many inputs are used to solve the problem. The subset of the architecture used here is a plain feed forward network with back propagation training, specifically used for regression problems like this one.
After building it a year ago and tweaking and adjusting the inputs and architecture and watching the results over the last year this is the result.
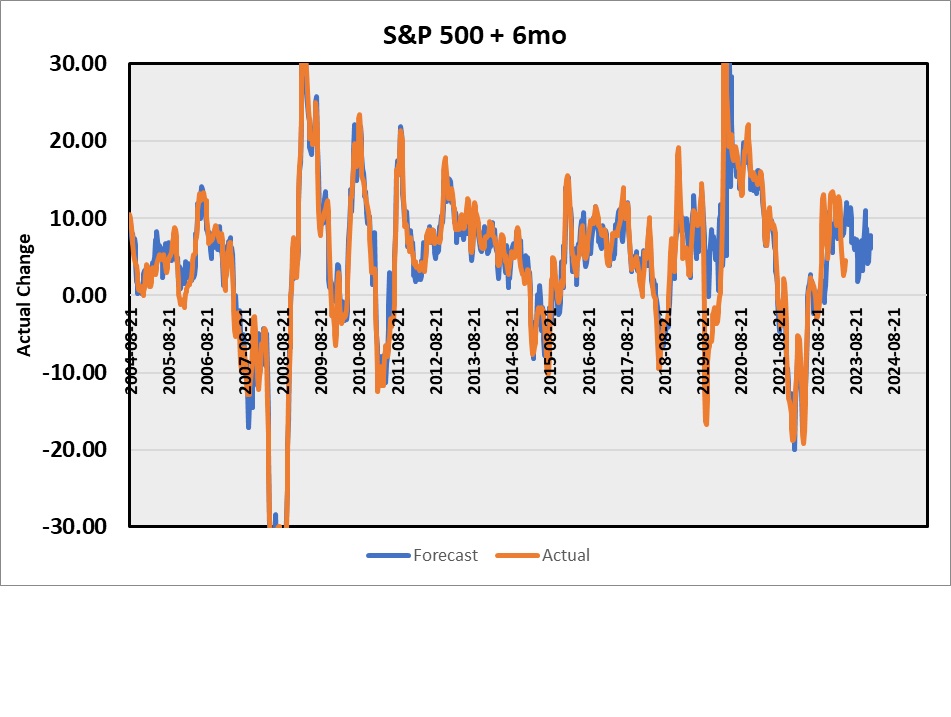
History Match of Neural Network
The orange line is the actual change in the S&P 500 stock index over 6 months, and the blue line is the history match of the neural network. During the training 10% of the data points were excluded to see if the network could predict them in a validation data set. Also excluded from the training was the period 6 months before and during the early part of COVID. To test the network an out of sample forecast for the last 2 years(excluded from training) was compared to actual. Using a survival of the fittest process the network was trained and re-trained discarding the networks that could not reasonably forecast the last 2 years.
It looks good to me but it is just a mathematical model that depends on the inputs, and also depends on if the input data has any information about the future. It knows nothing about COVID or any other plague, meteors, wars, unless the credit marks see this and freeze up anticipating a bad future, or the government responds by printing gobs of money (covid 19) driving down the credit market stress. You are warned to use with caution.
Recent Market Movements
The general sequence of events in the financial markets (and we are wedded to them with our financial economy) is bad stuff happens somewhere–resulting in credit market spreads widening (junk bonds dropping) as bond holders express concern about getting their money back. Then the central banks (and governments) respond by printing money. Money printing continues until the credit stress drops, and then for some reasons may go on for some years driving up financial markets to the moon. At some time, they stop the printing and try to take back the money-liquidity (if they overdid it) resulting in an increase in credit stress and this repeats over and over.

4 by 4 Matrix of Markets and Credit Stress
You can observe this sequence of events with this annotated graphic of recent credit stress
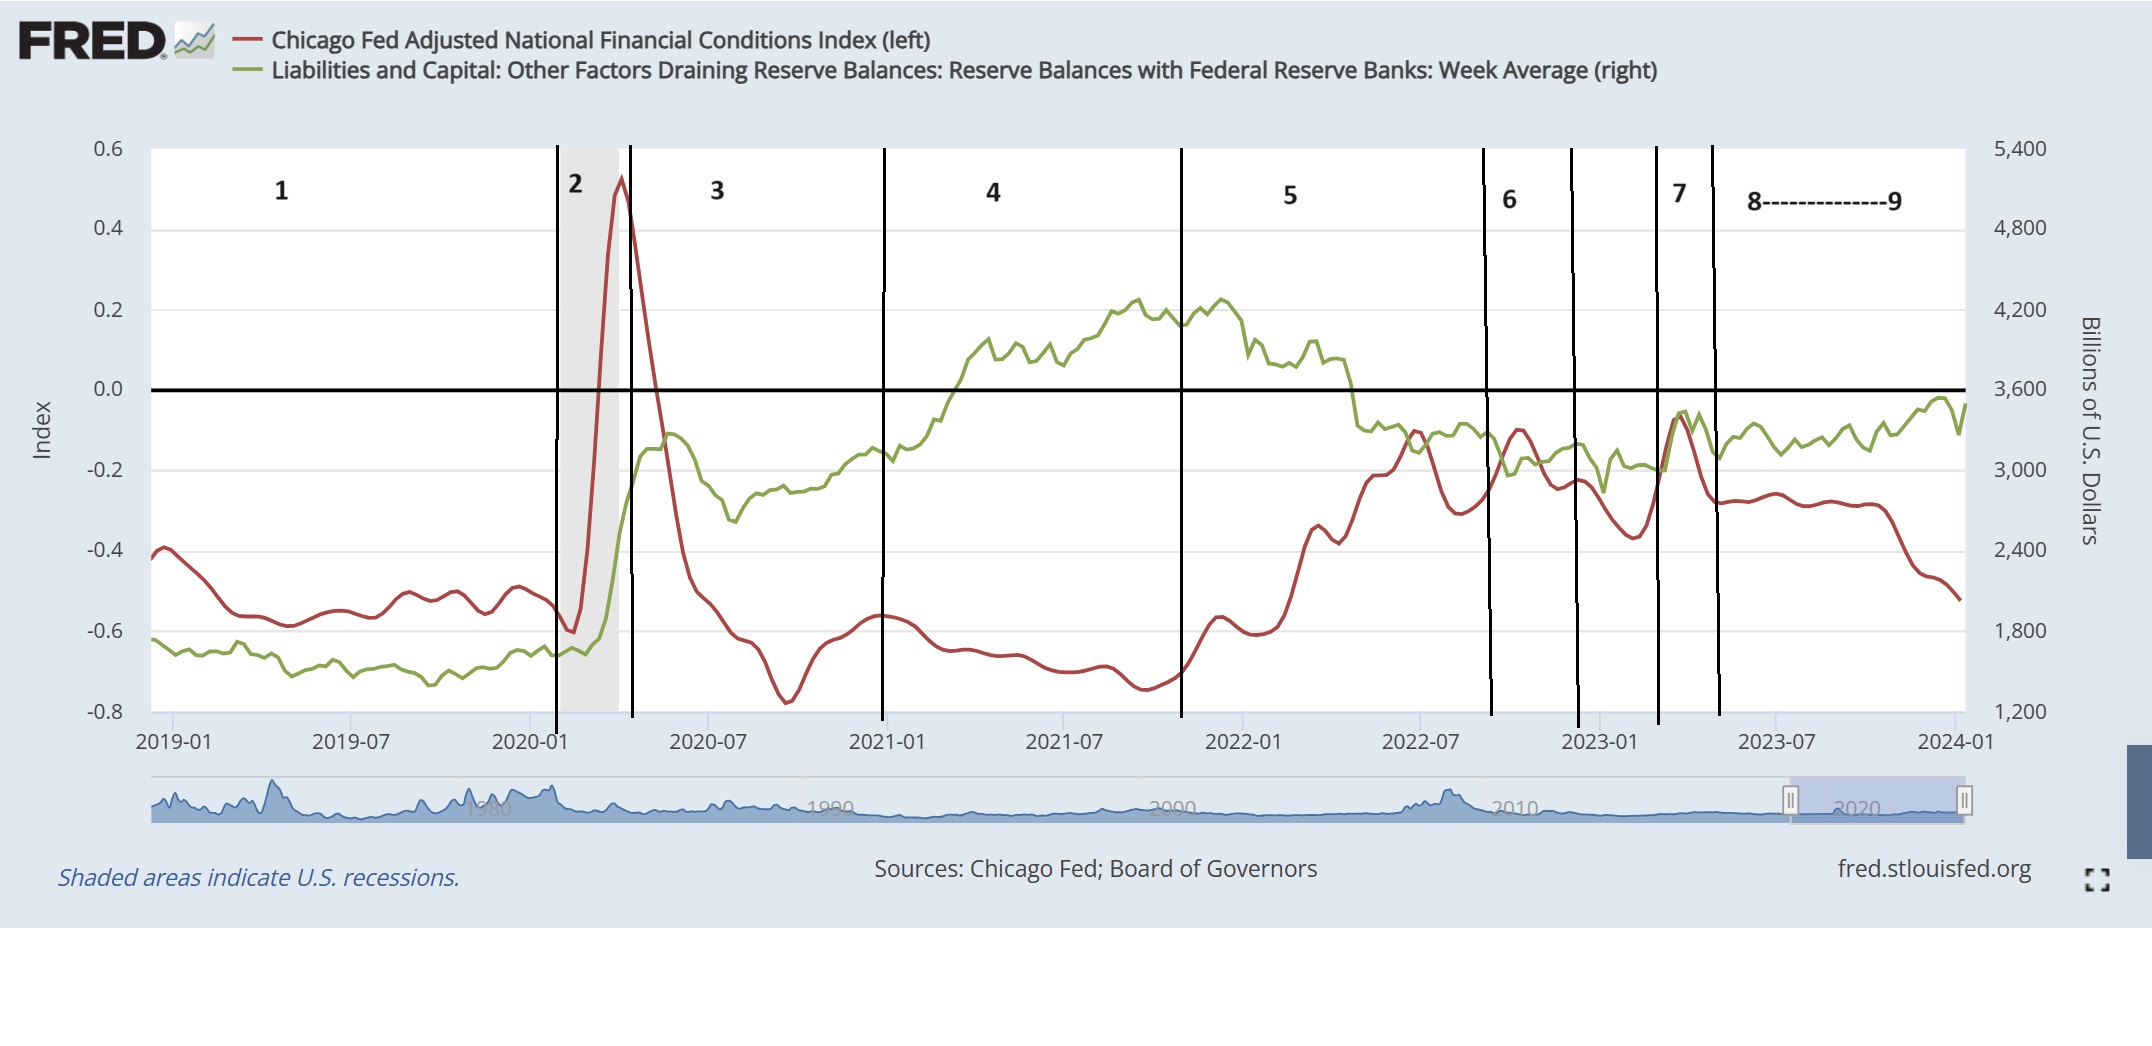
Above. The green line is the proxy for liquidity, essentially bank reserves of the US financial system. The red line is credit market stress or credit spreads(higher means more stress and risky borrowers require higher interest rates to borrow)
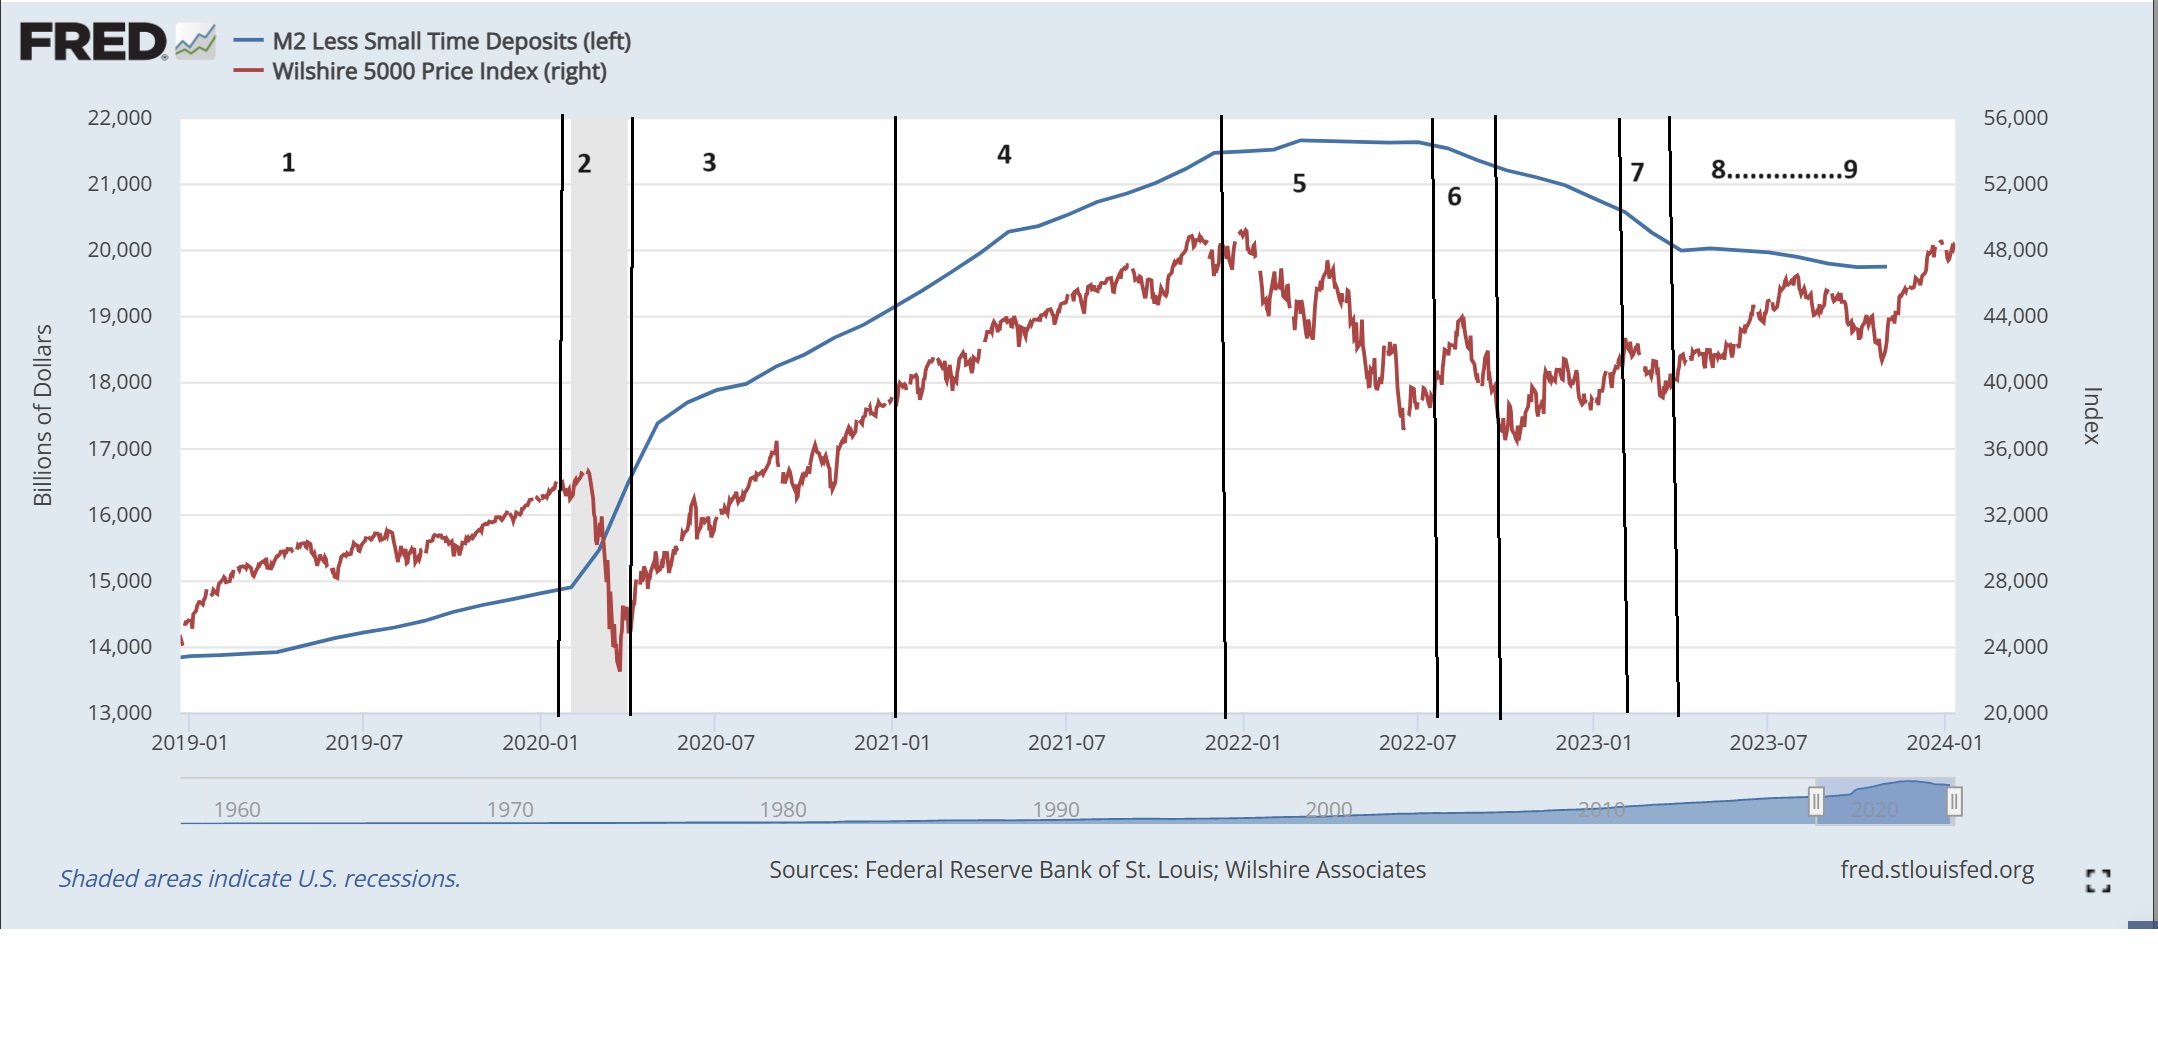
Below the blue line the the money supply of the United States(something else to pay attention to) and the Wilshire 5000 stock index(the largest 5000 stocks on US stock exchanges)
- Everything is awesome, money supply is increasing modestly and market is moving up.
- Covid hits and credit market stress increases.
- Central banks print money and credit market stress decreases
- Money printing continues for too long, stocks go into a bubble (stonks, bitcoin goes up, real estate investors are geniuses)
- Inflation heats up, central banks try to reduce the amount of money in the economy
- UK Pension funds implode, small pulse of liquidity to fix
- Silicon Valley bank, Credit Suisse and others blow up (mini crisis—small bump in credit stress)
- Stealth increase in liquidity
- AI stocks, Uranium stocks, bitcoin boom
- ???
It is hard to quantify liquidity in the economy since it can come from commercial banks when they lend to people and business, central banks with money printing, governments from spending or even international sources such as Japan and China. In all cases though it will show up in a positive or negative manner through the credit stress indicators, or in credit spreads and business bond indices. In this case the graphic shows for liquidity two examples the bank reserves of the US commercial banks (which the Federal Reserve prints) and “M2 less small deposits” which many entities can influence.
Conclusion
This short post is what has been owed to my readers to explain the Boom Doom indicator. This sequence of events in the credit cycle is observable back to the great depression of the 1930’s and with that track record it seems prudent to expect things will continue on that path. Neural Networks are a modern way to use the data to tease out more subtle market inter-relationships and predict market performance. With a guide post to the future, it should increase confidence to sell as market stress increases and buy when that stress is reduced due to ample liquidity in the financial markets. Remember though this is just a math model, not a genius, it only has 300 neural connections not the trillions that you the reader have so use prudence. As always this is not financial advice and in no way or shape should you use this website to pick stocks, use a financial advisor that is qualified to advise you on investing in the market.
Enjoy.