
Market Carnage
The recent drop in the energy stocks on the Toronto Stock Exchange(and other exchanges) is extreme and it is time to dig into the numbers and some of the causes of this recent stock market carnage and where the opportunities might be.
Energy Index
The TSX Energy index is down 35% as is observed in this graphic, some individual companies are down up to 60% from their recent high. No stock has been spared except for some international companies so this is a general market decline. The possible causes for this decline will be discussed later.

TSX Energy ETF, courtesy Stockcharts.com
Valuation Extremes
This market carnage has pushed the valuation of some individual companies to an extreme that I have not seen in many years. When I say extreme, stocks are trading for less than their PDP value. If you have read through this website where the nomenclature of the energy patch is explained, you know that this is equivalent to a house sells for less than the present value of the cash flow it could generate renting it out. I know if you live in Toronto or Vancouver this is just a fanciful idea that could never happen. On the Toronto stock exchange it is happening now(or at least at yearend 2018).
I included a table that has this comparison for all these companies(as of year-end 2018) that shows the % below this value for these companies.
| Company | % Below PDP | Company | % Below PDP |
| Toscana Energy | 775 | Cequence Energy | 79 |
| Granite Oil | 378 | Journey Energy | 60 |
| Petrus Resources | 241 | Advantage Oil and Gas | 59 |
| Obsidian Energy | 194 | Pine Cliff Energy | 56 |
| Prairie Provident | 169 | Crescent Point | 53 |
| Cardinal Energy | 152 | Chinook Energy | 48 |
| Razor Energy | 143 | Bellatrix Exploration | 40 |
| Painted Pony | 123 | Storm Resources | 37 |
| Crew Energy | 120 | TransGlobe Energy | 32 |
Other companies of notable mention trading close to their PDP value, or fairly valued if you just wanted to payout their future cash flow, are Whitecap, Surge Energy, Imperial Oil and CNRL. The surprising thing is the large cap companies trading close to this value. Now some of these companies are not investable due to their high debt load such as Bellatrix and Cequence, but some of the others are interesting. Razor Energy has shown up many times in stock rankings and Crescent Point is value that has a reasonable amount of debt.
Oil Price
One of the reasons this could be happening is the price of oil has recently fallen to $45.00/bbl, which is down from its high of $76.00/bbl. This extreme amount of a price drop in a two month period creates a lot of anxiety in the owners of these stocks that we are headed to another 2014-2016 period of oil over-supply and extremely low prices. If you check the page on this site where the inventory reports are detailed, we are not at the fundamentals that existed over that time period. Recently the seasonal total product inventories have increased on a year over year basis and this led the recent drop in oil prices. Watch for when this indicator starts to close the gap to the 5 year average to see that inventories are under control.
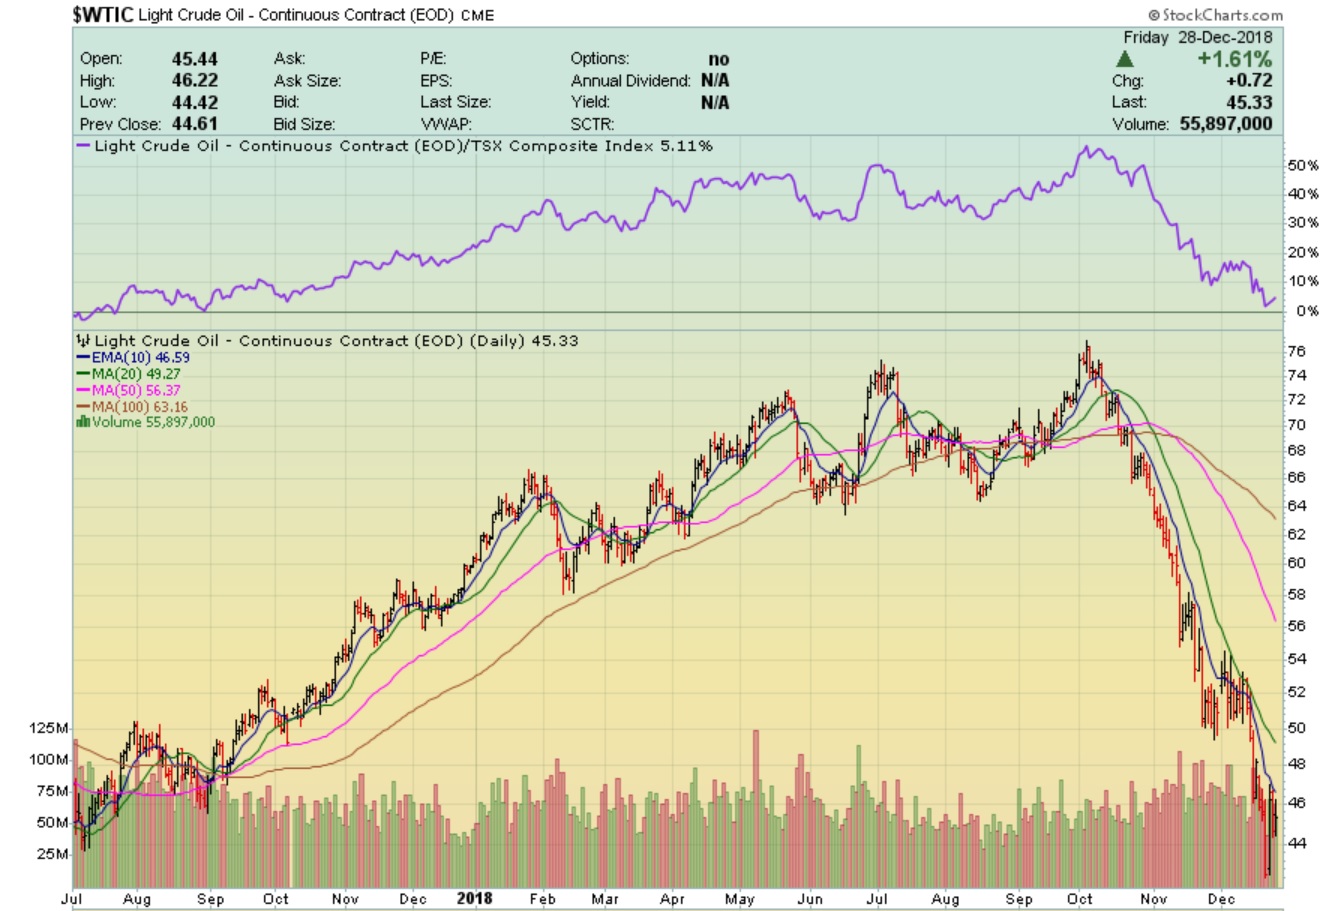
WTI Oil Price, Courtesy Stockcharts.com
Historically when OPEC has cut production the oil price and the stocks bounce upward. OPEC has announced cuts and this could be bullish for the market in 2019. Check out the blog post Look to the Past to Predict the Future to see what has historically happened
Market Risk
Another market animal that could be rearing its ugly head is a general Bear market. The bear market of 2008 was manifest by extremes in the credit markets(bonds and interest rates) caused by a banking crisis in the US and elsewhere. This market risk is captured in the Boom Doom indicator that is posted on this Website that could help guide purchases of stocks, or not, in the future. Right now the indicator is showing rising stress in the markets and this is influencing the oil markets and also the stock markets. This graph is for your information, amusement and education.

Boom Doom Comparison to TSX and TSX Smallcap ETF.
The small cap ETF is a proxy for the Junior oil index that has been recently brutalized in price. As you can see the Boom Doom(market risk) indicator seems to drop and drag the energy index and small cap index with it. Although it isn’t a perfect correlation it will help guide when it should be safe to jump back into these stocks.
Summary
So there you have it a very cheap oil stock market(for some stocks) with somethings to follow to see when it is safe to get back into those stocks. As an alternative you could buy a selection of cheap stocks that are growing now and just ride through the volatility that we should be seeing in 2019. Pay attention to the inventory reports, price of oil, Market Risk, and the valuation of the stocks you are buying in the market. Happy hunting, remember market carnage can be an opportunity.
As always please consult a qualified financial adviser before purchasing any stock as this blog is not to be construed as investing advice.
P.S. When I started writing this post the market had bottomed, some of the stocks have bounced 10-30% so adjust your pickings accordingly. There are still bargains but be choosy.
my portfolio is hurting, hoping for a bounce