Company Stats 2017
Last year’s reserve reports are finished, and it is a good time to look at last year’s financial numbers to see the star companies and the ones that are more “challenged”. This is also an opportunity to look at some of the metrics that I think are more useful when deciding to invest in an energy producer. Without further ado these are the Company Stats 2017.
Net Asset Value
Of course the first off the bat is the net asset value, specifically the upside available between what the reserve reports indicate the company is worth vs the value the stock is trading at on the market. For more color see some of my pages on reserve reports and net asset value elsewhere on the website. Specifically I look at the upside to the Proven Producing Reserves(PDP), Total proved(1P) and Probable reserves(2P) less the net debt of the company. For easy reading and comparison I group these together using some simple math that results in a fair value for the stock(100%of the PDP, 90% of the Proved, 50% of the Probable).
| Company | Upside to NAV % | Debt/Cash Flow |
| Cequence Energy | 1,499 | 4.3 |
| Ikkuma Resources | 864 | 16.9 |
| Bellatrix Exploration | 609 | 7.8 |
| Petrus Resources | 298 | 3.1 |
| Meg Energy | 275 | 30 |
| Painted Pony | 244 | 3.3 |
As you can see some of these companies have significant upside to the fair value of the stock, some also have high debt loads. Given that there is value beyond the debt that is carried by the company they could sell off some assets to pay off the debt(aka Paramount and Obsidian the former PennWest). Conversely they could push on but usually the high debt load hampers the spending on growth and the company flounders.
Production Growth per Share
The other metric that is useful is production growth per share. This allows a company to spend its money wisely, drill wells and overcome the depletion on their existing wells. The management team could also be very good at acquiring assets or production and add volumes that way. Conversely they could be like Crescent Point, and issue a considerable amount of share capital as they acquire and although they do grow, the existing shareholders get diluted away.
| Company | Production Per Share Growth(%) | % Natural Gas |
| Paramount Resources | 356 | 62 |
| Leucrotta Exploration | 187 | 66 |
| Athabasca Oil | 143 | 13 |
| Yangarra Resources | 98 | 41 |
| TransGlobe Energy | 82 | 6 |
| NuVista Energy | 47 | 58 |
| Seven Generations | 42 | 41 |
| Spartan Energy | 36 | 9 |
| Cenovus Energy | 34 | 23 |
| Tourmaline Oil | 33 | 82 |
Good companies with good assets can growth their per share production without issuing new shares or loading up with debt. These are the companies that I want to invest in, like Yangarra and Leucrotta. Paramount grew their production by acquiring the Apache assets last year and the jury is out as to whether they can grow the company effectively or not. Athabasca is interesting as they restructure and turn around what was once a successful “new” company.
Debt/Cash Flow
Now for the negative numbers. Debt/Cash Flow as I alluded to earlier is one of the primary risk metrics that you should look at before buying a stock, and this applies to companies outside of the oil patch as well.
| Company | Debt/Cash Flow | Production Growth/Share |
| Meg Energy | 30 | -16 |
| Ikkuma Resources | 16.9 | 5.6 |
| Pengrowth Energy | 9.2 | -55 |
| Bellatrix Exploration | 7.8 | 15 |
| PetroShale | 7.3 | -63 |
| Baytex Energy | 4.5 | 5.5 |
This table is similar to the Production/Share one but highlights the most debt laden of the oil patch. Another way of looking as this ratio is if the company didn’t invest in drilling wells at all, this is the number of years that it would take to pay off the debt. Given that some companies have decline rates of 20-30% means that in x years they would be much smaller if they dedicated that cash flow to their debt. Many companies in the history of the oil patch with debt/cash flow ratios of 4-5 and higher have eventually gone into restructuring or are forced to sell off many “prize” assets to continue operating. Some of the numbers are very troubling, Meg, Ikkuma, and Pengrowth have high debt loads and low growth, with a debt load that would take more than 9 years to pay off at the present cash flow run rate.
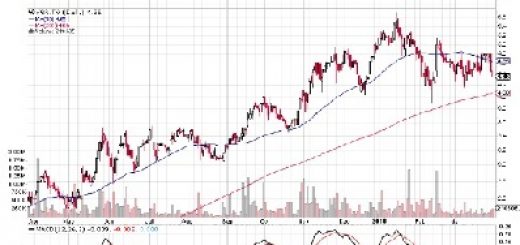
Momentum
I would be neglectful if I didn’t include a look at the shares that have gone up in value the most over the recent period of time. The momentum method I use is as simple as that with a % change over the last 5 month combined with % from 52 week high as a minor adjustment.
| Company | Momentum Rank | Upside to Fair Value |
| Gran Tierra Energy | 1 | -8 |
| Yangarra Resources | 2 | 2.5 |
| Enerplus | 3 | -34 |
| Parex Resources | 4 | -21 |
| Tamarack Valley | 5 | -22 |
| Blackpearl Resources | 6 | 149 |
The only problem with momentum as a pure measure is that some stocks can get overvalued and risky. Without some fundamental offset measure you can ride a stock up that promptly falls and you lose as much money as you make, in my opinion. Yangarra Resources is a subject of a previous post so I don’t need to write about it much here. The other stock of note is Blackpearl which has some momentum and still some upside to fair value, interesting.
All of these measures and a few more that are not mentioned here are combined to derive the stock rankings that are posted in the Data Table page of this website. As of the writing of this blog post the rankings of the stocks are posted on the page rather than the raw data so enjoy.
Well that is it the highlights of Company Stats 2017 and the best and worst of the stocks that were featured in this website. Stay tuned for coverage of some new stocks as a couple of stocks that have been lost to acquisitions(Spartan) and going private transactions(Cona) make way in the database for other companies to be looked at and quantitatively ranked. The coming year could be interesting as oil inventories are more balanced than in the past(maybe a future post). As always consult a qualified financial advisor before buying or selling any security since I am qualified to blog, not pontificate about if any stock is appropriate for your portfolio,