Market Risk Indicator, Part 2
In the blog post Market Risk Indicator, I wrote about the amount of debt in the economy and how different market based time series can be used to flag when there is stress in the credit markets. In this post I will write more about the market risk indicator that is posted weekly on NAV Information and go over how the indicator has changed with time.
1. Credit market stress can lead to problems in the equity markets
2. Energy stocks are affected by issues in the credit markets due to the need for capital and high leverage of many companies in the stock market.
3. The Market Risk Indicator can be used as a guide, not a panacea for other risk control measures or valuation measures, for when to invest in the energy markets.
4. The TSX Energy index is 43% overvalued when looking at the top 10 holdings of the index.
Boom Doom Indicator
First lets look at the Boom Doom indicator over time and understand what it shows us to do today.
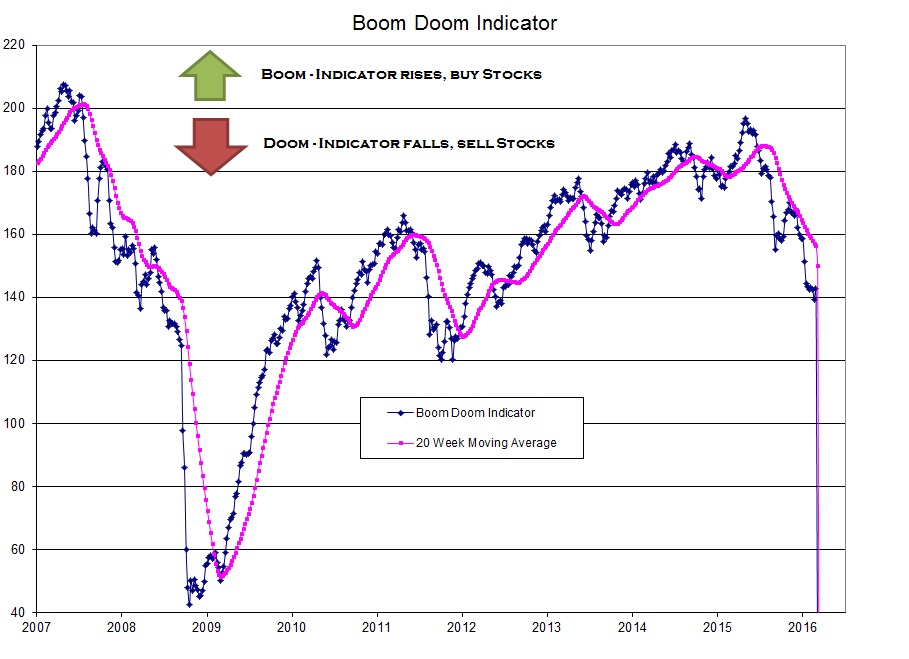
Boom Doom Indicator Feb 27 2016
In 2008 the banking sector seized up due to issues in the US banks related to real estate and junk loans that were on their books. The prices for those loans collapsed(interest rates soared) and money around the world stopped moving. This is the most severe period in the markets in recent history and the only thing comparable was the 1929 market crash. The one thing different this time was the reaction of central banks to pump money into the economy by “printing” money, causing the debt markets to start working again(see the total debt charts in the post Market Risk Indicator).
There have been several downswings in the market risk indicator in 2008, 2011 and more recently in 2015. The more recent downswing has not recovered yet, possibly because the US Federal Reserve has communicated that they will not rescue the markets yet and have more of an intention to raise interest rates than to pump more money into the economy. This lack of $US in the global economy causes the US dollar to rise against other currencies, causing stress in other economies that need those dollars to pay back debt or import goods. More specifically for the energy markets there is a high correlation to the rising dollar and a falling price of oil.
What can also be noted is some false signals, when using the 20 week moving average, where the index has crossed the moving average indicating a change in market sentiment. In 2008, 2012, and 2014 there were crosses where the primary trend then promptly resumed. This shows that the indicator is a guide and not a complete market timing answer as to when to invest in stocks.
If we use the Boom Doom indicator to decide when it is safe to buy energy(or other) stocks how has it fared over time? The only way to do this is to look over a period from before 2008 and use the data to time entries into the index and out of it and see what happens. First how have the energy markets performed over time.
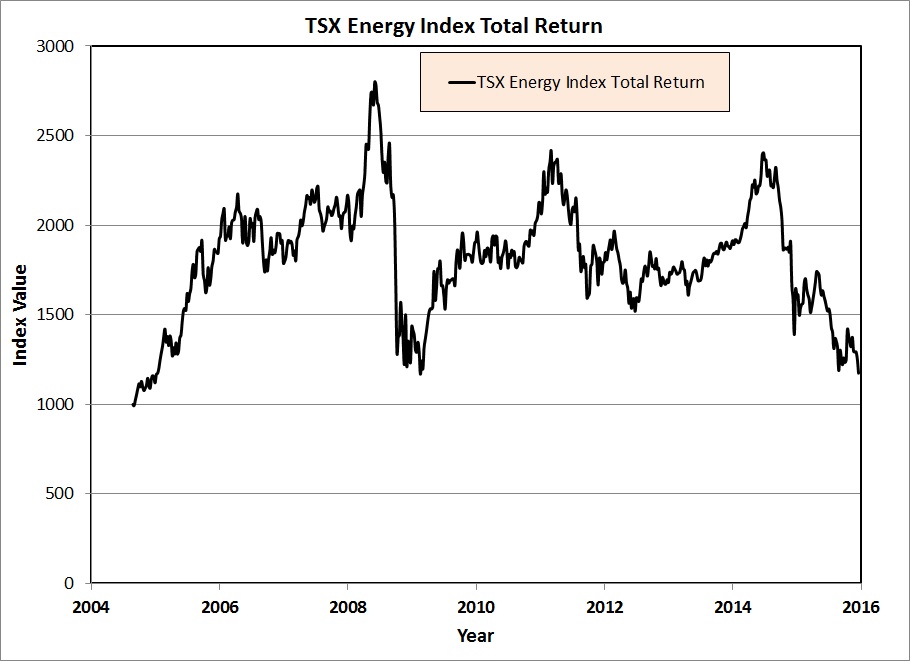
TSX Energy Index Total Return
TSX Energy Index
This is a total return graph of the Canadian Energy index over the last 12 years, not so great, almost a zero return(including dividends) over 12 years. It almost makes me ponder why anyone would invest in energy companies, perhaps banks and telecom stocks would be a better bet, specifically for buy and hold. The two concepts to get rid of are buy and hold and buying an index of energy stocks.
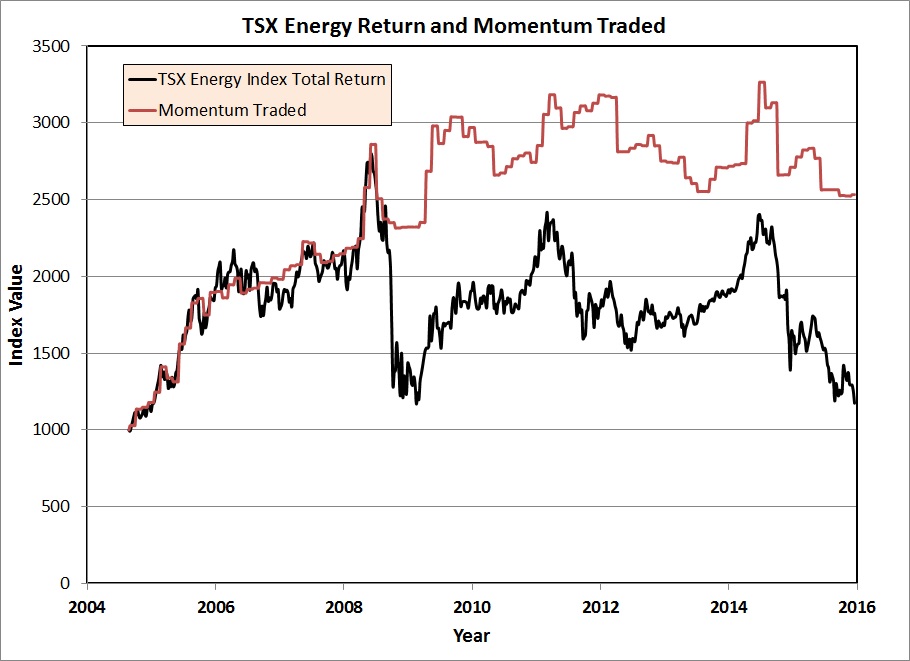
TSX Energy Index and Momentum Returns
This chart shows a simple strategy of buying the index when the momentum is positive (propriety and customized for the energy index) vs buy and hold. As you can see just the simple act of buying when the momentum is positive and selling when negative increases your wealth by 2.5x over 12 years. Now lets layer in using the Boom Doom indicator, buying when it is positive and momentum is positive, selling when it is negative.
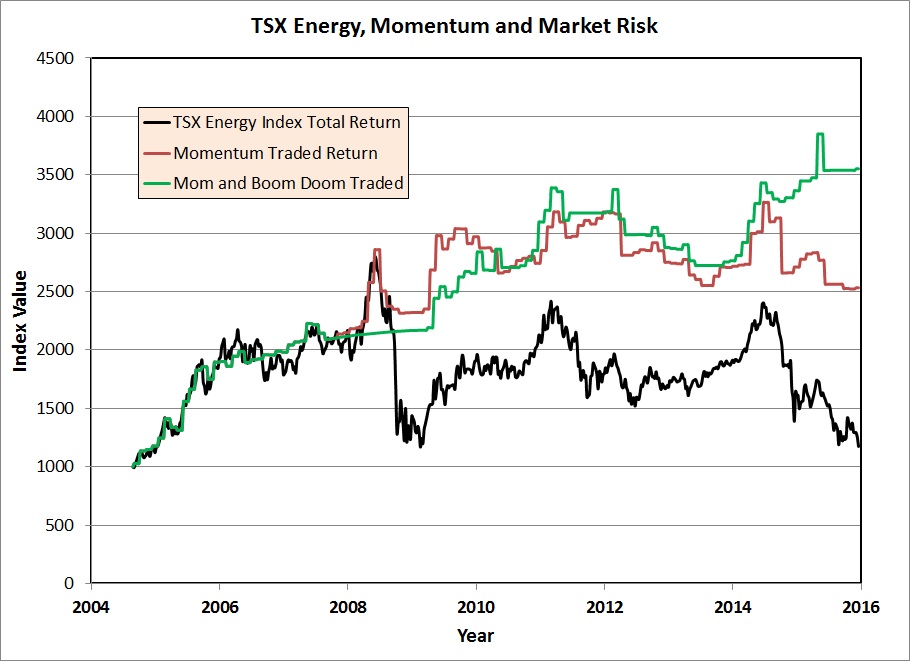
TSX Energy, Momentum and Market Risk Indicator
Much better 3.5 times vs 2.5 times for momentum alone, there still must be something wrong if the energy index goes nowhere over 12 years. I know some energy stocks that have doubled or more from the initial public offering, and Energy stocks should be a good place to invest and make money. What is wrong?
What is wrong the index is busted and overvalued due to the high weighting of Suncor and other “favourite” stocks and an underweighting of some out of favor value stocks. If you look at the top 10 holdings of the index as shown below, most are overvalued except for CNRL and Cenovus. On a weighted average valuation the index is 43% overvalued and not something to buy or invest in. Institutions and individuals are “hiding” in large more stable companies that pay a dividend causing them to be overvalued. Again the reserves on the website have not been updated yet to the new 2015 yearend numbers so time will tell what this shows, some will go up in value, others down. One of the major US tight oil independents just released their reserves for 2015 and the reserves went down by 15% and the value by over ½, so stay tuned.
| Company | Weight in Index | Upside to Proved Reserve Value |
| Suncor Energy | 28% | -56% |
| CNRL | 17.8% | 32% |
| Cenovus | 7.2% | 36% |
| Imperial Oil | 6.6% | -39% |
| Crescent Point | 7.9% | -48% |
| Arc Resources | 3.7% | -178% |
| Tourmaline | 2.8% | -89% |
| Peyto | 2.8% | -162% |
| Encana | 2.6% | -298% |
| Husky Energy | 2.4% | -23% |
Again buy the undervalued stocks and stay away from the overvalued ones. Right now is a good time to pick away at value, but by no means is the bear market for these energy stocks over yet. Market risk is high, but when the indicator turns up it may be a good time to accumulate those energy stocks that represent good value.