
Suncor, Great Company but Overvalued Stock
I thought it was time to start profiling some companies that are popular investments to see what their valuation is like and to argue their investment thesis. For this post we will look at Suncor, great company but overvalued stock price. Now that the Canadian Oil Sands corporate purchase has closed and Suncor has reported the Q1 financial results, we can do a deeper dive into Suncor’s financials, reserve report and value. Caution there are a lot of numbers in this post but maybe you just want the summary.
- Suncor’s debt and debt to cash flow is climbing sharply as they spend capex in the Ft. Hills oil sands complex and the acquisition of Canadian Oil Sands.
- Purchase of Canadian Oil sands was a good acquisition based on the price and reserve value, but didn’t materially change the net asset value of the company.
- Oil sands production, at the present oil price, is a poor business with poor return on capital. At greater than $80/bbl it is more interesting, but then so is the entire unconventional oil business in the US.
- Suncor shares are overvalued at the current price, and would need to drop to the $25.00 range to be a good value pick as a stock.
Suncor is an energy company that it would be hard to ignore. The largest Canadian oil company has the largest presence in the oil sands as well as ownership in the offshore oil fields in Eastern Canada, International Oil production and extensive refining assets and marketing operations across Canada. This is the go to energy stock for large institutional investors and retail investors that are attracted to it’s 3.4% dividend yield and stability of the refining and marketing assets cash flow. The question is whether it is a good investment at the present price?
Latest Quarterly Results
First let’s do a visual look at the latest quarterly results. Sometimes a graph can help illustrate a point better than a group of numbers.
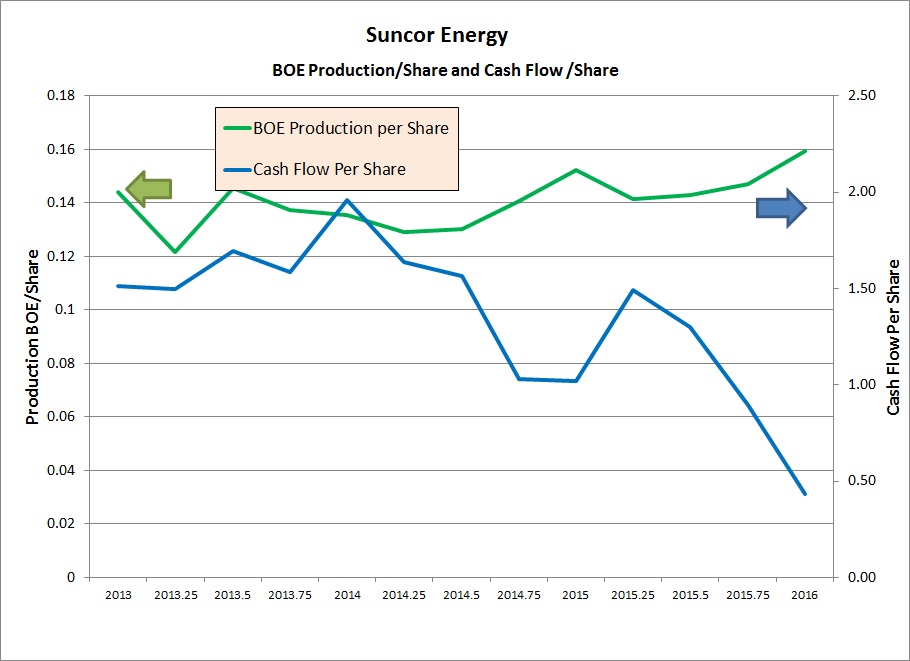
Suncor BOE Production and Cash Flow
This chart shows that production per share is up. Increasing production per share puts the company in a small select group in the floundering Canadian oil patch. Most companies are struggling to keep production flat and here we have the largest energy company in Canada managing to increase production, largely due to the acquisition of Canadian Oil sands. Cash flow per share is down though, down a lot and this should be expected since in Q1 oil prices hit the absolute bottom for this cycle. The cash generation numbers across the entire oil space were dismal in Q1.
Debt
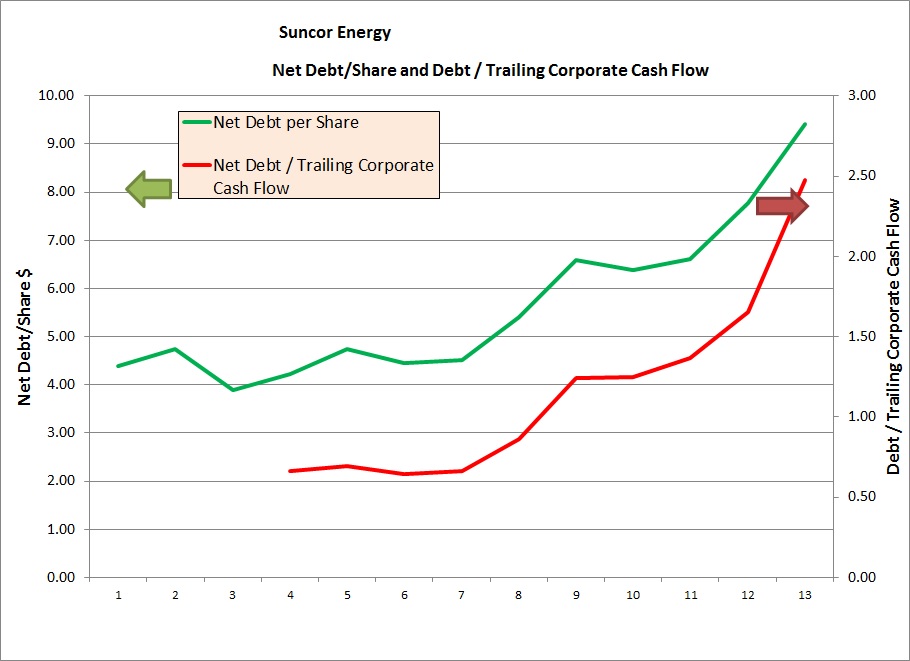
Suncor Net Debt
On this graph you can see the debt per share($9.4/share) and debt/cash flow(2.5x), both are climbing sharply. This debt increase is partly due to ongoing capital expenditure in the new Ft. Hills oil sands mine and the acquisition of COS. Of course if debt per share is climbing and cash flow per share is dropping then the debt/cash flow would also deteriorate. While this ratio is a cause for concern, and the sharp increase also a concern, it presently isn’t at a level where the company would have difficulties, like a PennWest, in my opinion.
Acquisition of Canadian Oil Sands
After the closing of the acquisition of Canadian Oil sands we should look at if this would be a value adding exercise, or a value destroying exercise. Since before this acquisition it was my opinion that Suncor was overvalued, doing an acquisition with company stock would be a good idea since you could issue overvalued stock and pick up some cheap assets. What about this acquisition, first what was paid?
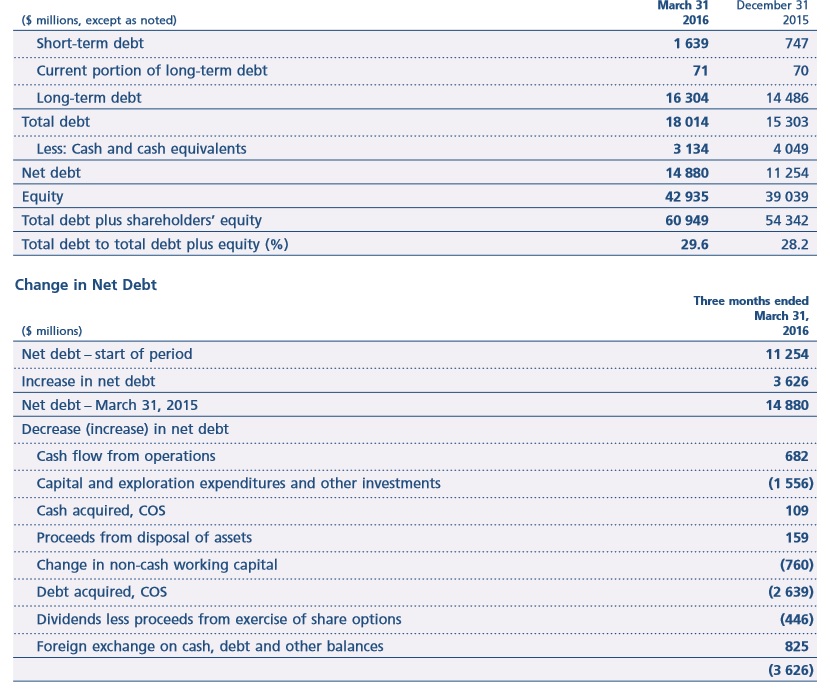
Suncor Change in Net Debt
First you can see that Suncor added about 2.5 billion in debt(net of cash) to it’s balance sheet.
Second look at the stock issued.
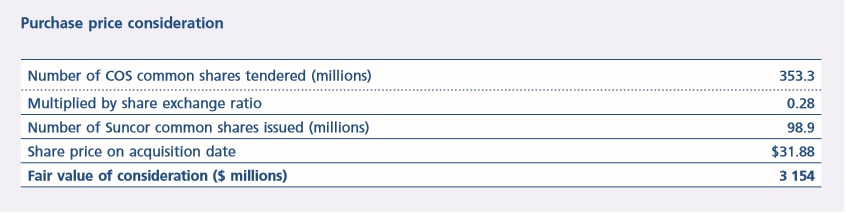
Suncor shares issued for acquisition
You can see they issued 98 million shares for a net cost of $3.1 billion. This gives a total cost of $5.6 billion to acquire all the shares of COS. Now what did they get?
There was no reserve report issued for Canadian oil sands for yearend 2015 so we have to take the 2014 report and make some grand assumptions and adjustments. I will assume that the COS oil sands mine has the same characteristics as the Suncor mining assets and apply the same year to year downward adjustments. At the end of 2014, COS reserve reports valued the company at a Proved value of $6.2 billion and a Proved plus probable value of $9.2 billion. In Suncor’s reserve report the mining assets dropped in value year over year by 32% so applying the same ratio these assets then would reduce the value of proved reserves to $4.2 billion, and P+P of $7.2 Billion. When we add these numbers of value to the Suncor reserves and roll up the latest balance sheet this is what we get.
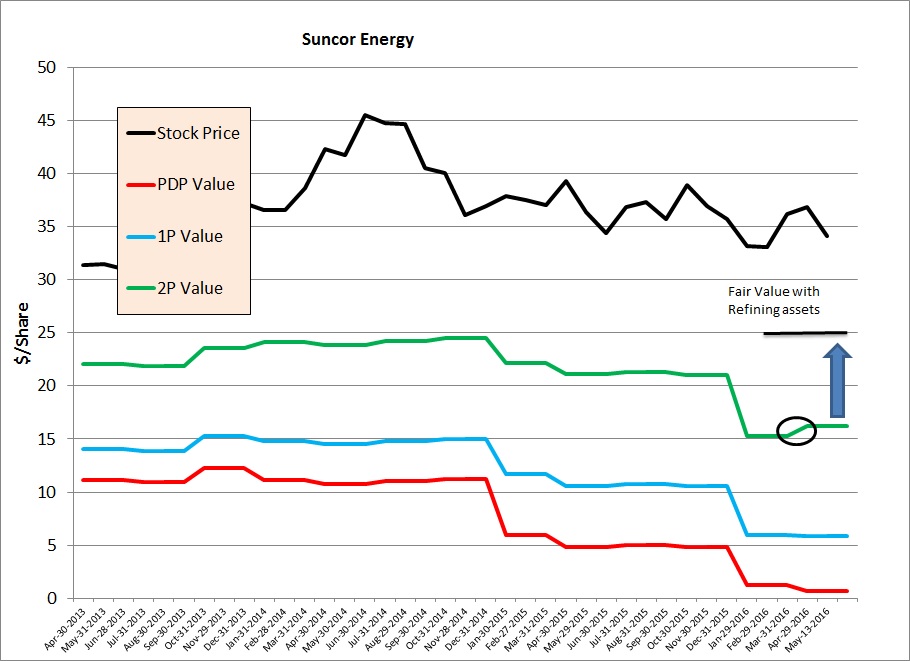
Suncor Share price and Value
The acquisition looks O.k. on a P+P basis since the cost was less than the P+P value, but on a producing asset basis their net asset value dropped.
Purely on a reserve value basis, Suncor is worth $0.67/share for the existing producing assets after you subtract debt, $5.90/share on a proved basis and $16.10/share on P+ P basis. What about the other value that shows up in the data table? This represents the value of the refining and marketing assets. These assets generate considerable cash flow year in and out and offer stability for the company to overcome these troubling times. This asset provides them with the cash flow needed to do the acquisitions and continue to invest in building out the Ft. Hills mine. On my calculations these assets generate cash flow of $375 Million quarter on average (net of sustaining capex, averaged since 2013) with a net present value of $14.3 billion or $9.0/share, nice. This would raise the Proved to $14.9/share and P+P to $25.1/share.
Operating Costs
What about the oilsands assets? Lets look at the fundamentals and jump to COS for simplicity and clarity. COS declared on their PDP reserve report, that their opex was anticipated to be $40.5 billion and sustaining capex of $8.9 billion for $0.65 billion bbl of reserves . That translates to $62/bbl opex and $13.6/bbl sustaining capex(replacing the mining equipment and turnarounds at the plant site are horrendously expensive) for a total cost of $75.6/bbl.
What about Suncor? On the latest quarterly financial their operating expense was declared to be $24.2/bbl, quite a difference.
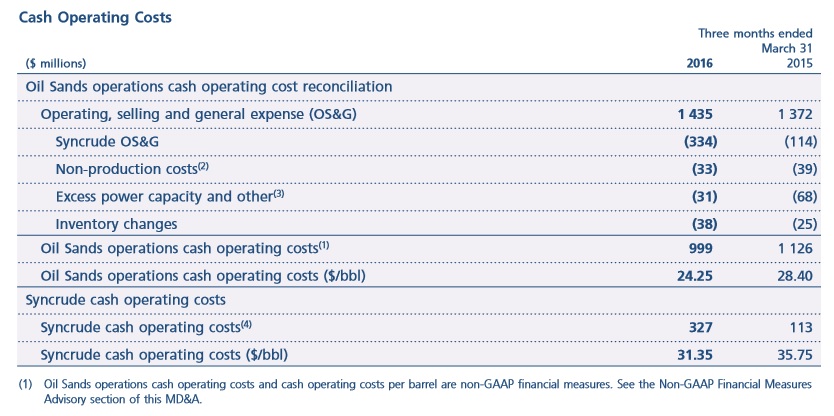
Suncor’s sustaining capex in the reserve report was $19.14/bbl. This gives all in cost(not including corporate costs) of $44/bbl. This is much better than what was declared as their reserve opex and sustaining capex of over $71/bbl. Have they improved their opex this much, or have they delayed some equipment replacement, maintenance etc. that will revert back when oil prices rebound, only time will tell. In any case you can see why in the 1990’s every company divested their oilsands assets, in a low oil price environment they do not make money, and struggle to break even. When the oil price rises sharply the long life reserves generate a wave of cash flow that does not have the constant drilling of a horizontal oil play to sustain production. The real question is do they need $55.00/bbl oil to be profitable, or $80.00/bbl.
There you have it a summary of Suncor, and the COS acquisition. While it was a good acquisition overall it did not change the thesis that the stock is overvalued. Given a drop to the $25.00 range it would be a buy for their long life reserves and refining and marketing assets, but at the present stock price I would pass and move on to better value. Of course you can find that better value on the website in the data tables.
If you haven’t noticed I have a new table of non-producer stocks that have a discounted cash flow valuation published for your use in the data tables tab called Other Companies. I will write about this table and the stocks more in the future but guess which stock is my favourite of the group analyzed so far.
As always, before you buy or sell Suncor, or any stock, please consult a qualified financial advisor about your decision.
The stock has gone nowhere in 10 years, even when the price of oil was $100/bbl. Sell, sell, and then sell